Nasdaq Forms Death Cross, But 3 Month Forward Return Is Positive
Nasdaq 'death cross' forms 'four horsemen' pattern
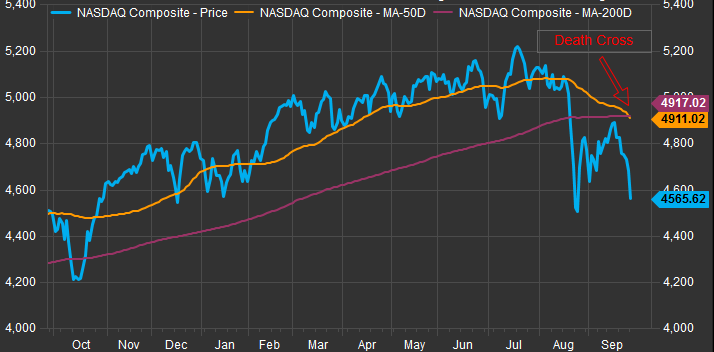
The Nasdaq Composite (COMP) spooked investors on Monday after forming a death cross, a trading pattern that shows a decline in short-term momentum and is often a precursor to future losses.
A death cross occurs when the short-term moving average of a security or an index pierces below the long-term trend, in this case the 50-day moving average breaking through the 200-day moving average.
In the past month, similar chart patterns formed in the S&P 500 (SPX) (SPY), Dow (INDU) (DIA) and small-cap Russell 2000 (RUT) (IWM), but the Nasdaq avoided a death cross formation until Monday.
Among the major averages, the domino effect was progressively felt as the drop in one index preceded the next.
"The Dow Jones Industrial Average triggered the sell signal in August, followed by the S&P 500 then Russell 2000," Brean Capital head of equity trading Roberto Friedlander wrote Monday, alluding to the deterioration in the market.
Friedlander explains that the Nasdaq's death cross formation, along with the three other indexes, marks the first time since 2011 that "all four horseman of the apocalypse" were in a death cross simultaneously.
Here's how Brean Capital is trading this technical development:
Nasdaq Composite 6 Month Chart
Source: FactSet
Since 1979, there have been 13 instances when all four indexes traded in a death cross, according to Brean Capital.
In those instances, the market returns in the short term or less than one month were "weak." In the long-term, however, the performance improved drastically with the market up 75 percent of the time three months out.
At the current levels, Friedlander thinks the S&P 500 is in the midpoint of a "significant" correction.
"Since the uptrend that began in 2011 was breached in August, we've been fairly confident that the SP500's price path has a greater than most imagine probability of passing through the 1700's before new highs are likely, and we continue to believe that SPX 1730 has a magnetic pull in a 'can test, could hold' kind of way," Friedlander said in a note.
"If we're right, 1730 would be a 38 percent retracement of wave three and, if it tests in Q4, there would also be potential support from the rising bottoms line which connects the 2009 and 2011 swing lows," he warned.
Courtesy of cnbc.com