
More Of The Same? - Weekly Market Outlook
After flirting with a big technical meltdown for weeks now, the market finally paid the price. Last week, the last of any potential floors were broken and the indices were taken into uncharted territory. The damage was significant too. In fact, it was the biggest weekly loss since 2011, and Friday alone was the biggest single-day drop since 2008.
Is more of the same on the way? Possibly, though in an ironic way, the severity of the pullback may also be working in the market's favor... at least in the near-term. The big dip already has some sidelined observers thinking about going bargain-shopping.
We'll weigh the possible outcomes below, as always, after a quick look at last week's and this week's major economic news.
Economic Data
Though we got a fair amount of economic data last week, the big news wasn't objective data, but rather, subjective data - the Federal Reserve's latest take on the economy and what that means for interest rates. The rhetoric was mostly dovish, in that the minutes of the most recent meeting said the economy was pointed in the right direction, but didn't seem quite ready yet for a rate hike.
It was also a fairly big week for real estate. Housing starts were up just a bit, from a pace of 1.204 million to 1.206 million, while permits fell from a pace of 1.337 million to 1.119 million. Later in the week we also learned existing home sales reached a multi-year high pace of 5.59 million units.
Real Estate Construction and Purchase Chart
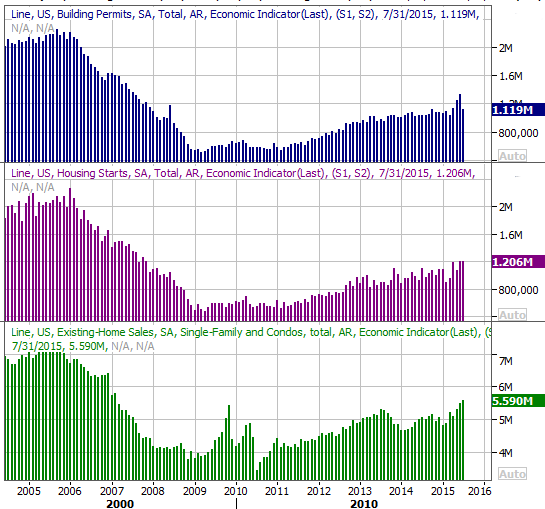
Source: Thomas Reuters
On the inflation front, there's still not much. Consumer prices were up 0.1% from June to July, with or without automobiles in the equation. The annualized inflation rate stands at 1.8% WITHOUT factoring in energy and food prices, but is only 0.17% with food and energy considered.
Everything else is on the following grid:
Economic Calendar
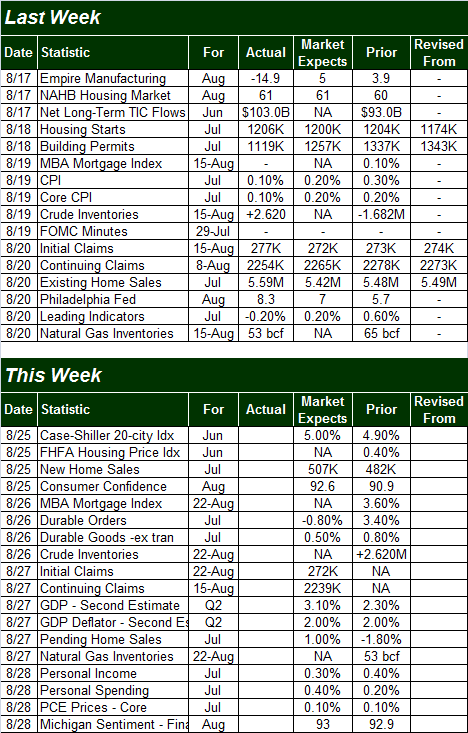
Source: Briefing.com
This week will be a bit busier, though not a great deal of this week's information is hard-hitting data. The biggies will be another round of real estate data, and a close-up look at consumer sentiment for August.
This week's real estate numbers will include two measures of home prices - the Case-Shiller Index and the FHFA Housing Price Index - though both are for June. We'll also get the new-home sales report on Tuesday. If these data points follow the lead of last week's real estate data, we should see continued strength there.
Home Price and New Home Sales Chart
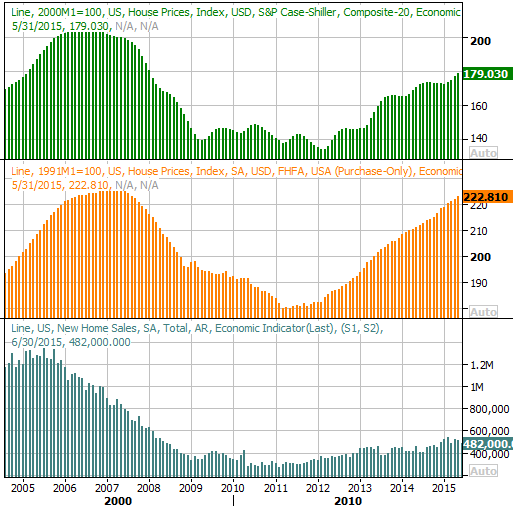
Source: Thomas Reuters
The Conference Board's consumer confidence score for August will be posted on Tuesday, with the final reading on the month's Michigan Sentiment Index score due on Friday. We don't see any major red flags with either yet, but another month or two of weakness could point to bigger trouble.
Consumer Sentiment Chart
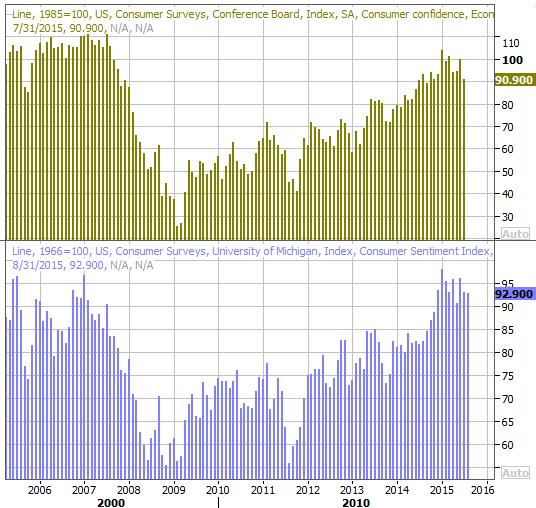
Source: Thomas Reuters
Stock Market Index Analysis
After last week, all bets are off. Whenever you start seeing headlines like "Worst since..." or "Biggest plunge in...", you know something incredible and unusual has happened, and there's really no certainty how the market will respond.
That being said, historically speaking, the odds suggest a bounce is in the cards this week. That's not a guarantee, obviously, and there's no assurance that bouncer effort will get any long-lived traction. In fact, with as much technical damage as the market suffered last week, it's going to be a challenge for the bulls to ultimately overcome it without a major, psychological overhaul and/or capitulation.
As the daily chart of the S&P 500 (SPX) (SPY) illustrates, after the bears put some major pressure on the 200-day moving average line (green) for the better part of the past two weeks, the floor finally broke... in spades. Once the 200-day line broke, the S&P 500 lost 5.1% of its value in just two days. As was noted already, it was a "first time in a long time" kind of event.
S&P 500 & VIX Daily Chart
Chart created with TradeStation
As for what's next, this is a case where the event itself isn't so telling, but the response to the event is quite telling. Translation: Pay close attention to how things unfurl from here.
We may see a decent bounce, but unless that bounce can push the index back above a now-huge ceiling around 2080, then the bears may still be in good control of this show. Look for a gradual slowdown (less-higher highs) from any bounce followed by a downward acceleration (increasingly-lower lows) from a peak after any reversal as a sign of the next leg of the intermediate-term pullback.
If the bears can get things going again, it's not likely last week's low of 1970.89 will be much of a floor. The would-be buyers will probably want to see a move at least a little bit below there to form a bottom.
The extent of the damage and the change in the ultimate direction of the market is even clearer on the weekly chart of the S&P 500.
S&P 500 & VIX Weekly Chart
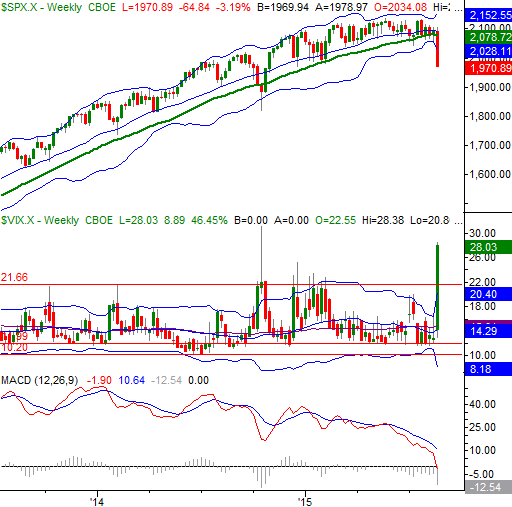
Chart created with TradeStation
Of course, the weekly chart of the S&P 500 also supplies the reason we're looking for at least a quick bounce in the very near future... as in early this week. We can see the CBOE Volatility Index (VIX) (VXX) just blasted past a major ceiling at 21.6 and logged the highest weekly close in years on Friday. That's a condition that's bound to burned off sooner than later, even if only on a temporary basis.
Conversely, if for some reason the S&P 500 manages to climb back above an entanglement of moving average lines around 2080, that could be encouraging enough to convince the buyers to keep things rolling in that direction. That would require a great deal of work and a little luck, however, to make happen right away.
Again, how traders respond to last week's action is the key. It could take a few days to get a true bead on their response, though.
Yields, Treasuries Say September Isn't the Month After All
Last but not least, though the FOMC minutes unveiled last week still said the economy was on pace for a rate hike in the foreseeable future, the behavior of bonds (TLT) and yields in the meantime implies the market thinks a September rate increase is less likely now than it was a week ago.
30-Year Treasury and Yield Chart
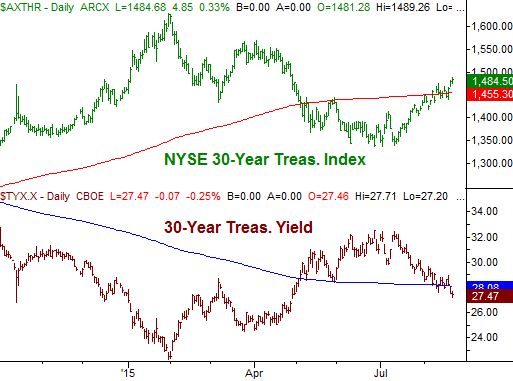
Chart created with TradeStation
Though the stock market's action last week largely drove the renewed assumption that a rate hike has been pushed back, just bear in mind the yield/bond picture has been and likely will remain a wild one.
Trade Well,
Price Headley
BigTrends.com
1-800-244-8736