Markets, Fed & The Dollar - Weekly Market Outlook
BigTrends Weekly Market Outlook
What started out as a fairly bullish week didn't end as one. The Federal Reserve's decision to not raise the nation's key interest rate inspired just enough doubt about the health of the global economy to send stocks lower on Friday. It was just enough of a stumble to pull stocks back into the red for the entire week.
And yet, there's still a way for the pullback to stop before it gets started in earnest.
We'll dissect that narrow path below, after taking a look at last week's key economic numbers.
Economic Data
There's no denying that the Fed's decision to hold the Fed Funds rate at 0.25% last week was "the" big news, but it's not the only economic news worth a closer look. We also heard last month's retail sales results, August's consumer inflation figure, and the number of housing starts and building permits the nation logged for last month. In order of appearance...
Retail sales for August were up, but not as much as expected, and not up impressively. Economists were looking for overall growth of 0.3%, and we only saw growth of 0.2%. Taking automobiles out of the equation, retail sales growth of 0.1% fell short of the 0.2% growth the pros were calling for.
Retail Sales Chart
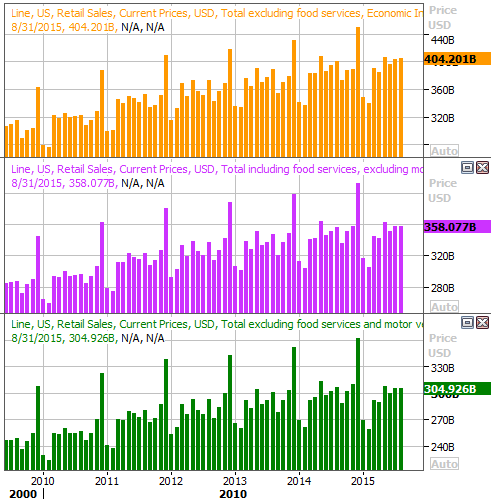
Source: Thomas Reuters
No chart necessary for last month's inflation data - the annualized rate now stands just under 0.2%, near where it's been for several months now. Even taking ultra-low oil/gasoline prices into account, however, the core inflation rate is standing at a very palatable 1.8%. There's little inflation for the Fed to try and fend off.
Last but not least, on Thursday we got housing starts and building permits for August. Permits were up, and starts were down. And, starts were better than anticipated while permits fell short of estimates. Regardless, both remain in bigger-picture uptrends.
Building Permits, Housing Starts Chart
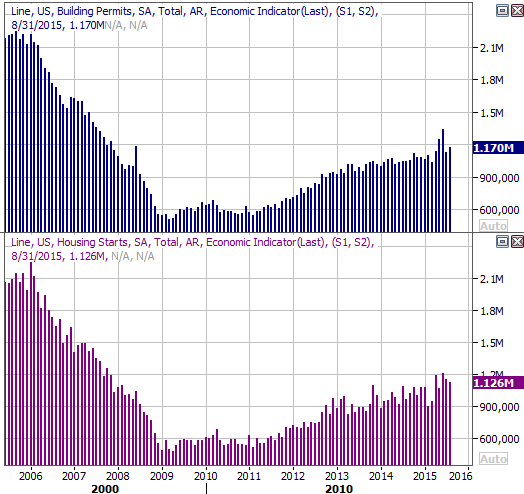
Source: Thomas Reuters
Everything else is on the following grid:
Economic Calendar
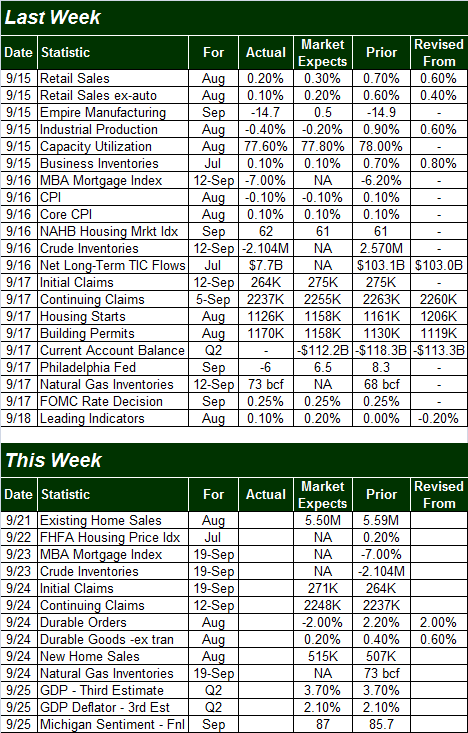
Source: Briefing.com
This week isn't going to be quite as busy, but it's going to be a particularly big week - again - for real estate data. Last month's existing home sales, the FHFA Housing Price Index, and new-home sales for August. Broadly speaking, all three are trending higher, and are expected to stay relatively firm through last month.
Home Sales, Home Price Chart
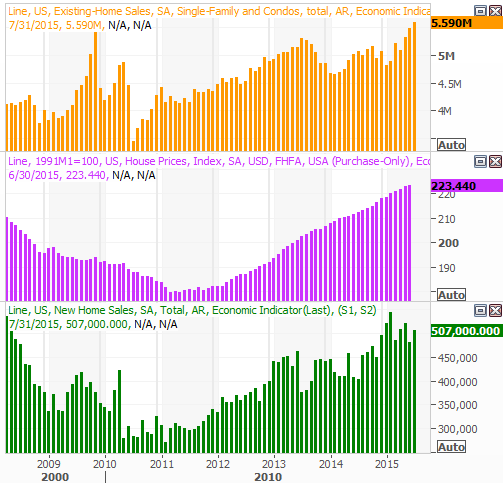
Source: Thomas Reuters
Stock Market Index Analysis
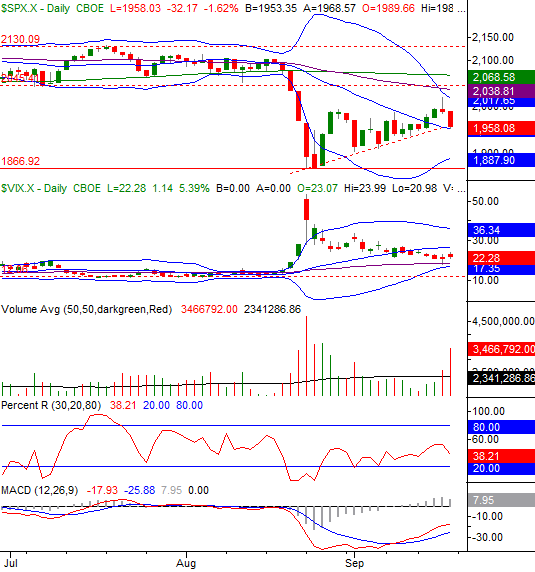
As was noted, the intermediate-term trend is still leaning bearish, and as of Friday, the short-term trend had turned bearish again too... almost. One more lower low will take the indices below some key support levels that could fling the index considerably lower. The daily chart of the S&P 500 (SPX) (SPY) illustrates all of this fairly plainly.
In retrospect, the timing of the bearish reversal and the location of the bearish reversal makes perfect sense. Sometimes investors need catalysts like a Fed Funds rate decision to justify a change of heart, and just as often a chart needs to bump into resistance or support to change direction. When they both happen at the same time (as was the case last week), we have to respect those reversal effort.
For the S&P 500, you'll notice the market peak after a decent, three-week runup formed just a few minutes after the Federal Reserve announced its decision to hold the Fed Funds rate at 0.25% on Thursday afternoon. By that day's close, the bears had already taken charge again, and then followed through on Friday. That high on Thursday was logged pretty much at the S&P 500's upper Bollinger band as well as near its 50-day moving average line (purple)... two common technical ceilings.
S&P 500 & VIX Daily Chart
Chart created with TradeStation
It's also no coincidence the CBOE Volatility Index (VIX) (VXX) pushed up and off of its 50-day line it brushed on Thursday and continued to edge a little higher on Friday [an expiration day, by the way].
Given the timing and situation, it's not a stretch to say this was a pre-determined plan of action for investors; they were just waiting on the catalyst. If that is indeed the case, it's also not a stretch to suggest those subconscious plans were to take the market even lower than Friday's close.
The daily chart of the NASDAQ Composite (COMP) looks quite similar, though actually offers more clarity and precision. That is, the NASDAQ precisely touched its 50-day line (purple) on Thursday, and though it moved above its 200-day moving average line (green) on Thursday, before all was said and done the bears made sure the composite didn't close above that critical long-term moving average.
NASDAQ Composite & VXN Daily Chart
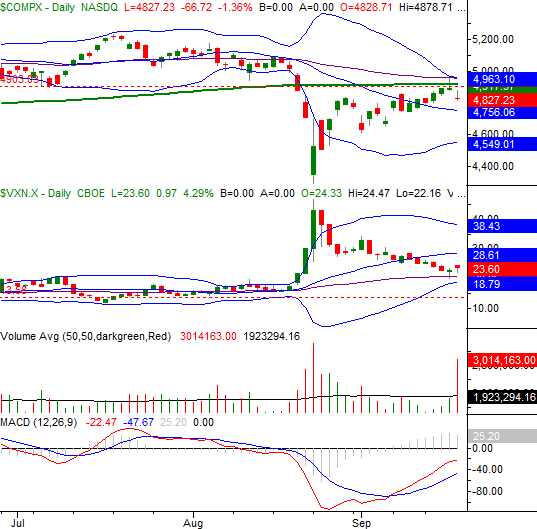
Chart created with TradeStation
On both charts, a thick layer of potential resistance was verified, and became confirmed resistance. That's going to make it even tougher to hurdle the next time stocks try to do so. That being said...
Despite Friday's pullback and net loss for the week, you'll notice the S&P 500 has yet to break back under its 20-day moving average line at 1952.77. It's also just barely broken under the rising support line (dashed) that tags the string of higher lows that extends back to late August. The bulls could still make a stand there.
For more much-needed perspective, take a look at the weekly chart of the NASDAQ Composite. It's in this timeframe we can see (1) the 50-day and 200-day moving average lines have both become resistance lines, and (2) the NASDAQ Composite is just 115 points (2.4% of its current value) from breaking back under a major, long-term support line (dashed) that extends back for years. The composites broke under that floor four weeks ago and then quickly bounced back. The market may not be so quick to save the market twice in a row, however, with another breakdown this close to the last one.
NASDAQ Composite & VXN Weekly Chart
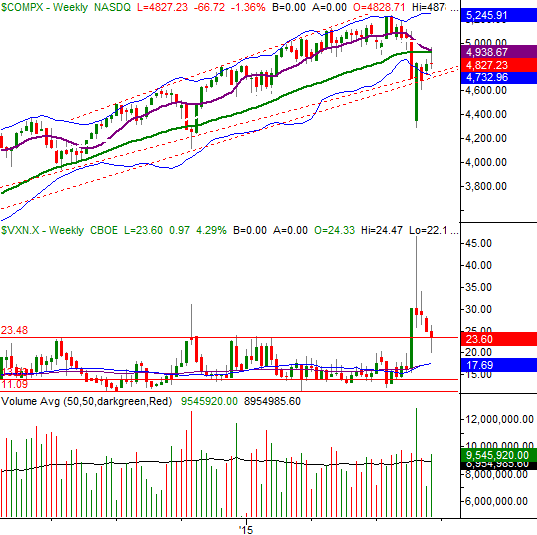
Chart created with TradeStation
Watch all the charts closely this week. The short-term breakdown has yet to get going in earnest, and possibly might not. Even if it does though, there are still some key floors laying in wait not too far below where we are now. For the S&P 500 that's 1867, and for the NASDAQ, that's the lower Bollinger band currently near 4550.
U.S. Dollar Breaks Down
Last week we warned that the U.S. dollar (DXY) (UUP) was knocking on the door of a significant technical breakdown. In the meantime, it happened. Specifically, the U.S. Dollar Index broke under a support level that had already breached once, and also broke back under the last of its moving average lines. We can also see now a couple of the shorter-term moving average lines ended up capping rebound efforts before they could get started in earnest.
U.S. Dollar Index Chart
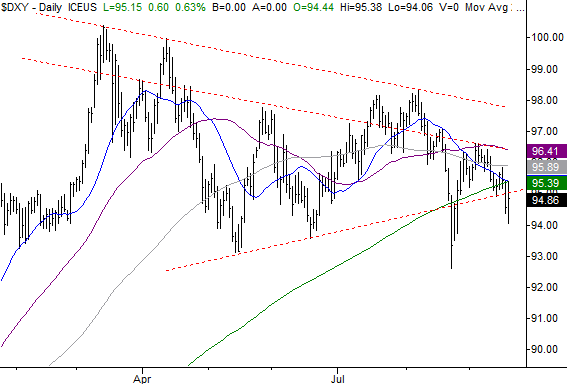
Chart created with TradeStation
There's still room and reason for the U.S. Dollar Index to bounce back and forth, but this is a lot of technical damage. It's not necessarily a bad thing, however. Remember, a weak dollar means U.S. multinational companies' products are more affordable to overseas customers. Plus, a weaker dollar may actually inject a little healthy inflation into the equation via higher commodity prices.
Trade Well,
Price Headley
BigTrends.com
1-800-244-8736