What to do when the traditional 'safe have' trade is breaking down
Stock-market diversification is said to work because assets have different boom/bust cycles. As long as the booming of some assets offsets the busting of others, a diversified portfolio is deemed to be low(er) risk. This strategy works ... until it doesn't.
Right now, the traditional diversification or “safe haven” trade is breaking down.
Under textbook circumstances, bonds boom while stocks bust and vice versa. The two assets are supposed to have an inverse relationship (offset each other). Recently however, stocks and government bonds have been falling at the same time.
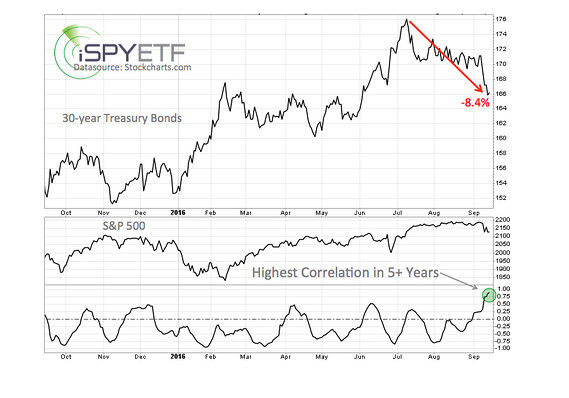
The chart below plots 30-year Treasury Bond (TLT) prices against the S&P 500 SPX, -0.51% (SPX) (SPY)
The bottom graph shows the correlation between both assets, currently at 0.92 (1.0 = 100% correlated, -1.0 = 100% inverse).
This deviation from the norm is a simple curiosity for many, but a costly annoyance for asset-diversification proponents.
Why is the safe haven trading breaking down?
Treasurys encountered the perfect storm. The July 7 Profit Radar Report warned that: "30-year Treasury prices are at all time highs. Commercial hedgers have racked up the highest short exposure since 1998, while the 'dumb money' is piling into the crowded traded. Sentiment truly is worthy of a sizeable reversal."
After a multi-decade bull market, U.S. Treasurys appear to have run out of buyers. The position of the stock market didn't really matter. The law of supply and demand trumps any correlation.
What about stocks? A couple of weeks ago, the bearish S&P 500 divergences became too obvious to ignore, that's why the August 28 Profit Radar Report stated that: "Our focus is now on the most likely scope of any pullback. Initial down side target: 2,150-2,130."
Stocks and bond prices simply adhere more to their market-specific indicators than to textbook correlations. As the correlation panel at the bottom of the chart shows, such periods of parallel trading aren't all that unusual.
Another non-performing safe-haven trade is gold. Gold (GLD) is supposed to rally when stocks fall, but this hasn't been the case lately.
There are probably a number of lessons to be learned, but the most important one is that each asset class has a mind of its own, its own dynamics, and deserves its own stand-alone research.
The best way to reduce risk is to only buy an asset because it's worth owning, not because it's supposed to go up when something else goes down.
Courtesy of marketwatch.com