It wasn't clear it was in the cards. In fact, until yesterday it appeared as if gold was going to roll over again, unable to push past a major technical hurdle around $1269. With the right circumstances and a little luck though, gold futures sent a clear message that they're in an uptrend.
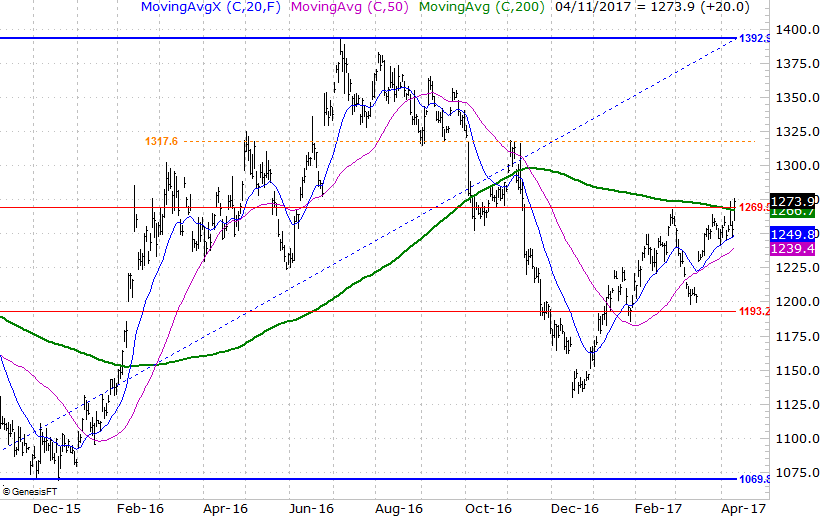
The daily chart of gold below tells the tale. The big technical ceiling was a combination of the 200-day moving average line (green) and the 61.8% Fibonacci retracement line… a retracement of the span between the December-2015 low of $1069 and the July-2016 high of $1392. The $1269 level had even acted as resistance before — in February — and did so again late last week. After some wrangling though, the bears gave in and the bulls won the day. Now above $1269, it becomes much easier for gold's bulls to push forward.
 [1]
[1]
With all of the key moving average lines in the rear-view mirror, the next logical ceiling for gold is back at the previous peak of $1392. That's not a terribly realistic target though… at least not straight-away. It may ultimately get there, but gold is apt to bump into a major headwind or two in the meantime.
The most plausible interim target is the $1317 area, where gold futures peaked in November of last year, but also where they found a floor in September. Indeed, that area's been support and resistance a handful of times in the recent past. That line in the sand makes the most sense as a checkpoint target, meaning we'll look for a move to that value first and then reassess the odds of finishing the move to $1392. Obviously a move beyond $1317 would be a good sign that the ball's going to go ahead and roll all the way to $1392. But, first things first.
In any case, the new bullishness from gold has implications, in conjunction with what's going on with stocks as well as bonds.
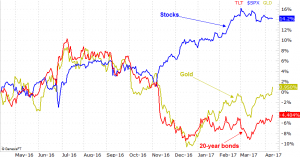
Generally speaking, between stocks, bonds, and commodities [we’ll use gold as the proxy], at least one of the three is always rising, and at least one of the three is always falling. There are occasional short-lived exceptions, but by and large they each tend to gain at another's expense, and/or fall to the benefit of another. The performance-comparison chart below makes this idea pretty clear. Though they all moved in tandem in the latter half of 2016, as of November stocks diverged from gold and bonds.
 [2]
[2]
Take a closer look though. All things being cyclical, the recent strength from gold and bonds is clear, as is the recent lull from equities. Stocks aren't in any major apparent trouble yet, but there's no denying gold and bonds (partially, though not entirely, for the same reason) are rallying. If they continue to do so, it's only a matter of time before traders pull money out of stock holdings in a big way and allocate those proceeds to the better-performing arenas of bonds and gold.
Obviously there are no guarantees in trading, but charts don't lie. Bonds and gold are both making higher highs right now, and stocks aren't. Until that undertow clearly changes, it can't hurt to keep this possibility in the back of your mind.