Extreme Market Volatility Similar To 2011 & 2008
The S&P 500 Hasn't Seen This Many 'All or Nothing Days' Since 2011
This shows just how extreme the trading has been.
Here's another sign of just how extreme recent stock market trading has been.
As Bespoke Investment Group points out, "all or nothing days," or trading sessions when the number of advancing stocks minus the number of declining stocks in the S&P 500 reaches more than 400 or less than negative 400, has seen a huge pickup in recent months. August's dramatic selloff was a case in point, while last Monday's market dip saw 499 of the 502 stocks in the S&P 500 fall in tandem.
Here's Bespoke:
Since the sell-off really began in earnest on 8/20/15, the S&P 500’s daily advance/decline reading has been above +400 or below –400 on eight trading days through Friday (as of 2PM Monday, the S&P 500’s A/D reading is currently above +400 again).
On a rolling 12-day basis, Bespoke says we haven't seen this many "all or nothing days" since the selloff of 2011 or the financial crisis of 2008.
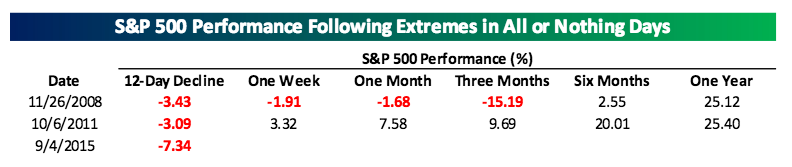
To put that in perspective, prior to 8/20 there had only been 13 trading days in all of 2015 where the S&P 500 had an all or nothing day. We looked to see how common it has been to see eight ‘all or nothing days’ over a 12 trading day period, and found that since our daily breadth data begins in 1990, these events have been extremely rare. In fact, the only two periods where we have seen this type of occurrence was during the financial crisis in late November/early December 2008 (where we saw five straight daily occurrences) and on one day during the 2011 correction on 10/6/11.
There is, however, a silver lining.
According to the note, the market tends to recover quite nicely, even if it does take a month or more. Here's a chart from Bespoke looking back at what the S&P 500 did following the last two instances.
Courtesy of bespokeinvest.com and bloomberg.com