Understanding ETF "Flash Crashes"
by Dave Nadig
The most useful part of the Hitchhiker’s Guide to the Galaxy, according to the eponymous novel by the late Douglas Adams, is that it has the words “Don’t Panic” written on the cover in large friendly letters. ETF investors would do well to take those words to heart.
Monday, dozens of ETFs traded well below fair value in the morning, and yesterday, pundits and reporters were scrambling to extract proximal causes and juicy headlines from the chaos. I spent Monday staring at tapes and reviewing timelines, and here’s what I think: the market did exactly what it’s designed to do, what it was told to do, and what it’s been regulated to do. If you find that slightly scary, well, maybe you should . . . and maybe you shouldn’t.
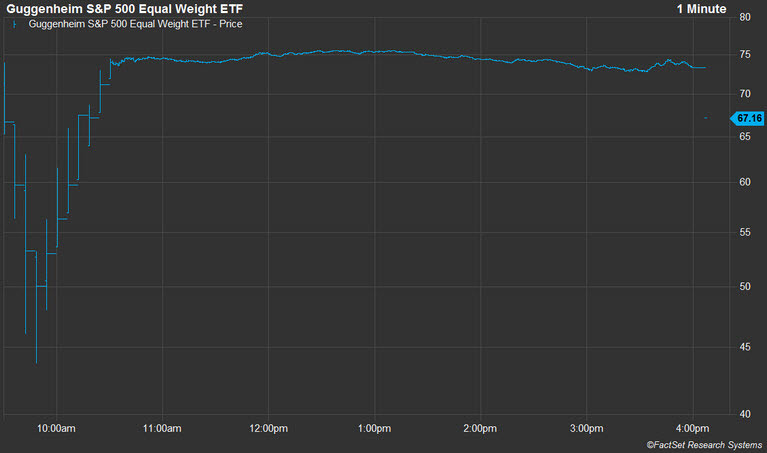
My poster child for Monday’s craziness is the Guggenheim Equal Weight S&P 500 ETF (RSP). I chose this ETF for a few reasons. First, it was one of the stocks most heavily hit in the May 2010 flash crash, and second, I like to imagine if I were a market maker or an engineer designing trading algorithms, it’d be an easy mark.
It’s liquid, with over a million shares a day trading hands, but not so liquid that there’s no opportunity to arbitrage out price differences or make money on the spread. Its underlying securities are ridiculously easy to trade, and in a worst case scenario, you can hedge any RSP position with any S&P 500 derivative or ETF and for a short period of time and get pretty close.
RSP got hit hard Monday before it recovered, trading below $50 when “fair value” for the underlying stocks never dropped below $71.
So what happened? Let’s go in time series order.
Pre-Opening
On a normal day, the designated market makers at the NYSE fire pre-opening indications of where they intend to start making a market – what their best bid and offer is going to be. Because of the chaos of Friday’s trading, the NYSE opted to invoke the rarely used “Rule 48.” Rule 48 effectively lets the DMMs not tell anyone where things are going to open until they start trading, removing a level of information from the market.
But remember, not every trade has to go through the market maker, and not every trade has to go through the exchange. So before the open, we had bids and asks being put up on Nasdaq in the range of $70.50 to buy and $74.19 to sell – a very wide opening spread – which implies to me that the market makers were either waiting for the dust to settle or very nervous about the opening trade.
The Open
The market opened with an opening cross of some 70k shares at $72.52 on NYSE, right in the middle of that advertised spread and probably close to the fair value as best anyone could guess (chaos was reigning in S&P 500 stocks at the same time, so it’s a bit of guesswork). That opening auction seems to have gone off without a hitch and pretty rationally.
But that’s when things get squirrelly. While technically trades were occurring right from the start, the best bid/ask was from Nasdaq for the first 20 seconds or so of trading and very wide: $59.22 to buy and somewhere between $65 and $75 to sell.
In those opening seconds, roughly 100,000 shares changed hands in very small lots (many under 100 shares, many of a single share) between $74 and $65. That lower boundary trading triggered the first of 10 halts.
The Halts
Between 9:30:28 and 10:30:06, nearly a full hour, trading in RSP only occurred in 15 to 30 second bursts between halts. The current single stock circuit breaker rule is that any move of more than 10% within a five minute window triggers a halt. So trading halted four times on down moves and six times on up moves as it recovered.
In each window, the tape looks something like this:
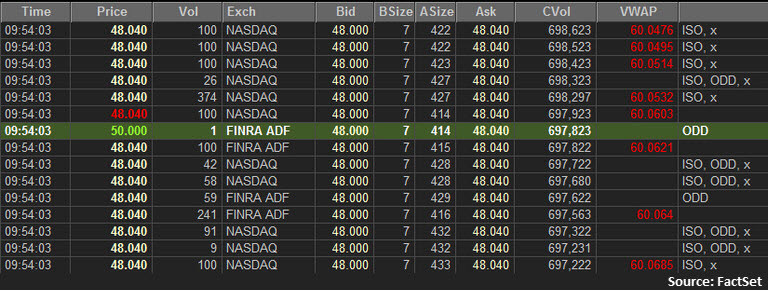
The pattern is consistent: most trades flagged as “Intermarket Sweep,” which means it’s a market order to take out the book. Tons of them are odd lots, including many single share trades. In fact, during the hour long halt window, 4,079 trades occurred in the 2:29 minutes that RSP was open. Of them, 1,371 were for less than 100 shares.
The other thing to note is the crazy imbalance of advertised bids and offers. During the rundown, there were effectively no advertised offers to buy. Once RSP started to recover, the buyers came in in droves, and the market couldn’t process the orders fast enough to clear them out during the narrow windows when RSP traded. For much of the period, the total advertised size on the bid was less than 100 shares, while there were tens of thousands on the ask.
So What?
Here’s my interpretation of what happened, recognizing that this is voodoo tea-leaf reading.
- Market makers stepped away. Market makers are in the business of avoiding risk. When irrational actors are at work (and let’s be clear, anyone selling RSP for half off isn’t being rational), the smartest thing to do, if you’re the actual human being watching RSP trade, is to simply step out for a cup of coffee. That means stubbing out your bid and ask to a point you think nobody will hit.
- HFT algorithmic trading was a big part of what we saw. I say this for a few reasons. Firstly, no human being trades one share of anything. Second, about half the trades were flagged as intermarket sweep orders (ISOs), the common form of HFT trade which values speed over price. Mom-and-pop investors aren’t flagging their 80 share trades as ISOs, in my experience. Third, someone selling RSP for $50 when it was demonstrably worth $70 is irrational and working against their profit motive. Since I believe human traders generally express their irrationality more subtly, I think this points to broken HFT models that were unloading positions without regard to price or fair value.
- Sleeping-stops kill. Of course, not every trade was an HFT algorithm. To the extent any “regular” investor was hurt in RSP during the hour of doom, it was likely from a stop-loss order they had sitting on the books. If you had a stop to sell if RSP crossed under $70, say, right after the open, your order became a market order, and you could have been executed anywhere in the line of terrible trades.
- The market structure worked. I doubt any of these trades will be canceled. They happened in an orderly, logical fashion (just at stupid prices). The invocation of Rule 48 worked, in that the market makers at the NYSE were seemingly able to step out of the way and let the market come in and fill up the book before they had to act and advertise their own prices. The halts did exactly what they were supposed to do. You can complain all you want about what happened, but you can’t claim the system broke.
- There are still real issues. I’m unconvinced that the current market structure is actually well-suited to this kind of activity. This is a market where information is processed in milliseconds, yet we have five-minute trading halts. This is a market that increasingly thrives on complete transparency, yet the exchange rule for dealing with volatility is to actually remove transparency. This is a market where speed is often valued over price—and we have an entire set of regulations to ensure that’s OK—yet we cry “foul” when speed is actually more important than price. Lastly, if we’re concerned about protecting individual investors, we need better education and controls around the most dangerous tool in the ETF investor’s toolbox: the market order.
For most investors, a day like Monday simply won’t matter because they’re smart enough to treat their ETFs not as “bets” to be put on and off the table on a whim, but as long-term asset allocation vehicles. From that perspective, RSP—and all the other ETFs that had hiccups—are still doing just what they say they do, day in and day out. It’s only by wading into the madness on purpose that your experience will differ.
Courtesy of http://www.factset.com/