Tuesday Turns Into a Pivotal Day For the S&P 500, Market

Bad news for investors today... probably... possibly. The S&P 500 along with most other major market indices have tested a key floor, and even fallen below it for a brief moment. The bulls have managed to push the S&P 500 back above that support for the time being, but the bears have tipped their hand - they're not afraid to take a shot.
The daily chart of the S&P 500 below tells the story. After several days of being unable to get and stay above the 20-day moving average line (blue) -- let alone the horizontal ceiling at 2371 -- the S&P 500 has started to attack the 50-day moving average line (purple) as a floor. It broke down as support today, for a while, though stocks have partially rebounded in the meantime. Nevertheless, with a second lower high now in place and a major support level under attack, it wouldn't be crazy to start getting worried.
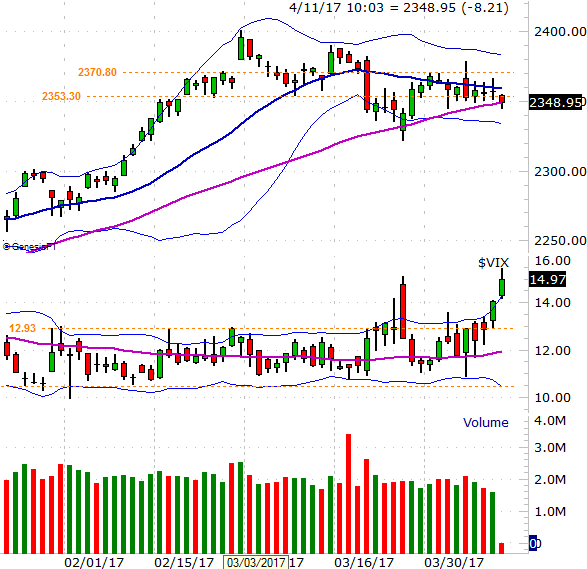
Perhaps the most alarming aspect of the S&P 500's chart above is also the most reassuring. That is, the VIX has finally broken out of a long-standing trading range with a ceiling at 12.9. Indeed, it's the second time we've seen it happen since March. This time it's done so with a lot more follow-through. Thing is, it may have done so with a little too much follow through, racing too far and too fast to be sustainable. If that's the case, then fear has already peaked, meaning the market has already hit a bottom. The 50-day moving average line would be an ideal place for the S&P 500 to make a major pivotal low.
Zooming out to a weekly chart puts this possibility in perspective. From this timeframe we can see (1) the S&P 500 still has a lot farther to fall before it retests the longer-term support of its 200-day moving average line (green), and (2) the VIX has a lot more room to rise before it bumps into its key ceiling 17.5, where a major Bollinger band currently lies.
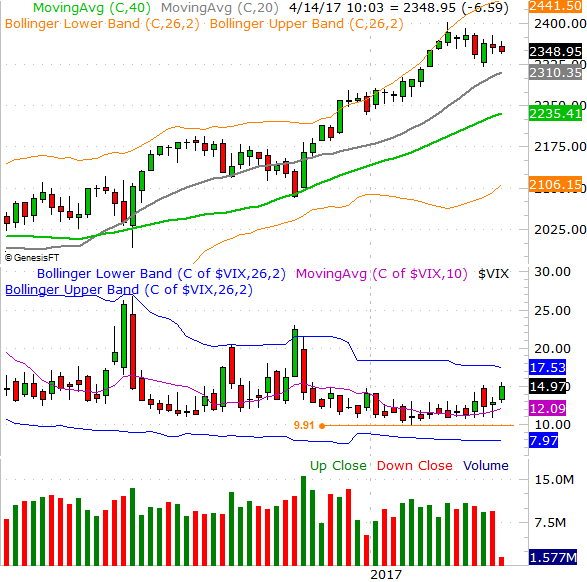
It's clear the VIX is trending higher now. What's not clear is that the more the VIX rises, the more that upper Bollinger band will start to rise too. That band could be well into the 20's by the time the VIX catches up, which in turn means the S&P 500 itself could fall quite a bit. The VIX and the S&P 500 are inversely correlated (albeit not perfectly).
The weekly chart of the S&P 500 and VIX also clarifies that stocks have already developed a downtrend, by virtue of a string of lower highs going back to the early March peak.
Something else the weekly chart reminds us.... the rally since November has not only been unusually strong, it's getting a little long in the tooth. We don't usually see advances last this long without at least some sort of interruption. The bears may well decide to make up for lost time by taking aim at the 200-day moving average line, currently at 2235.
Of course, that's only going to be the case if the S&P 500 and the VIX don't follow through on their subtle reversal clues they've given us today. First things first. The only thing we know for sure right now is, the stage is set for something important.