Crude Oil is Closer to a Technical Recovery Than You Might Think
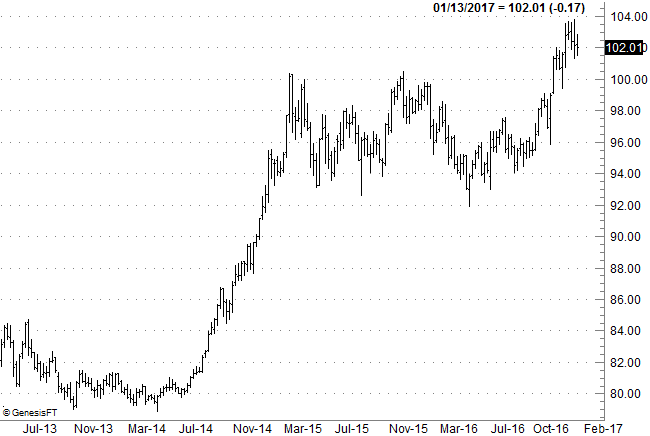
Despite most of the media's (and most of the pundits') unwillingness to acknowledge it, the biggest drag on crude oil prices hasn't been too much supply. It's been the incessantly rising value of the U.S. dollar. Up 27% since the middle of 2014 -- spooky by ForEx standards -- and reaching new multi-year highs in late December, the U.S. Dollar Index's meteoric rise has wreaked absolute havoc for oil, and by extension, for the companies that drill for it.
In that light, it's curious and a little surprising that crude prices have managed to double since their late-January lows hit in the latter part of January last year. Indeed, the bullish action we've seen since then against a backdrop of reasons why crude oil shouldn't be moving higher is exactly why we need to respect that bullishness, and take its hints at face value - the commodity's chart is more bullish than the recent weakness from oil would suggest.
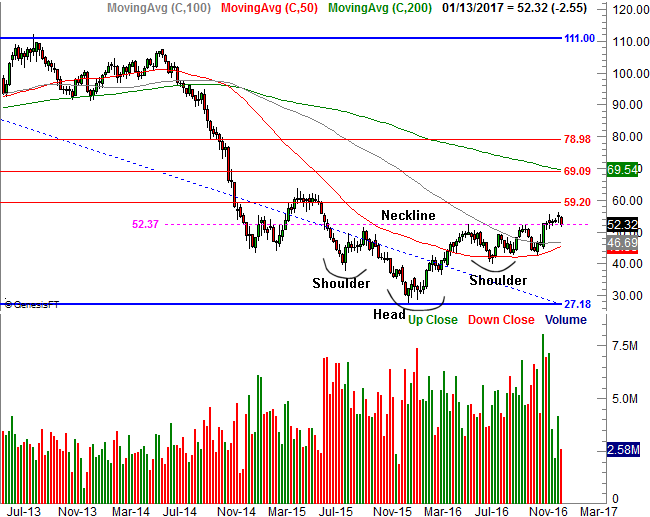
It's not even close to being an ideal one; they never are. But, since the middle of last year crude oil futures have quietly been forming an upside-down head and shoulders pattern. The neckline at $52.37 was broken in December, but didn't lead to the immediate breakout that was supposed to unfurl. As was noted though, there's never a perfect head and shoulders pattern. The spirit of the pattern is what counts, and though it's not panned out yet, the underpinnings for bullishness are in place. The next move back above $52.37 could be the catalytic one.
No, the suggestion doesn't quite jive with oil's fundamentals.... to the extent oil's overt fundamentals suggest things should be taking shape anyway. Regardless, this is the way things ARE taking shape, so there IS an underlying reason.
Based on the usual head and shoulders theory, the break above the neckline should roughly be the same distance as the distance between the neckline and the top of the "head." In this case, that's the difference between $52.37 and the early-2016 low of $27.18. That differential of roughly $25 suggests crude oil should rally $25 above $52.37 if-and-when it manages to make the breakout move. That puts it at just above $77.
That's a very aggressive goal, with lots of stumbling blocks en route. There's a 38.2% Fibonacci retracement line at $59.20, and the 200-day moving average line (green) currently at $69.54 -- but falling fast -- could be contentious as well. There's a very good chance crude oil won't get to $77 in a straight line, assuming it gets there at all. But, it's interesting that the target established by the head and shoulders pattern almost perfectly coincides with the 61.8% Fibonacci retracement level. There are few coincidences in trading.
Still, $77 per barrel, when most pros are only looking for something between $55 and $60 before the end of the year? Don't laugh. As was already explained, the rising dollar did most of the damage, but now the U.S. dollar is not only overextended, it's very vulnerable to a pullback. Some observers think the looming rate hikes have already been priced into the greenback's value, and then some.
Whatever the case, to the extent traders should respond to what the market is doing rather than what they presume it should be doing, crude oil is just a few cents away from what could be surprisingly solid recovery move.