Weekly Market Outlook - Volume & Volatility
Weekly Market Outlook
What started out as only a modest possibility last week didn't take long to turn into the worst-case scenario. The S&P 500 (SPX) (SPY) gave up 3.6% of its value last week... the biggest weekly drop since the one that did the core of damage in mid-August.
Uncertainty regarding the health of the economy after a few-too-many disappointing retail earnings reports was largely to blame for the weekly setback, though uncertainty surrounding the near-term future of interest rates took a toll as well.
Of course, it may also be possible that stocks were overbought and simply ready for some profit-taking.
We'll consider all of it in a moment, after a quick run-down of last week's and this week's major economic news.
Economic Data
The only item of real interest last week, in terms of economic news, was October's retail sales data. It was up, but not as much as expected. Retail spending grew 0.1% overall and 0.2% excluding cars, but analysts had forecasted growth of 0.5% and 0.3%, respectively. Still, consumerism is making forward progress.
As the chart below shows, on a year-over-year basis, overall retail spending is still growing, which is made doubly impressive by the fact that it's offset significant decreases in gasoline sales.
Retail Sales Chart
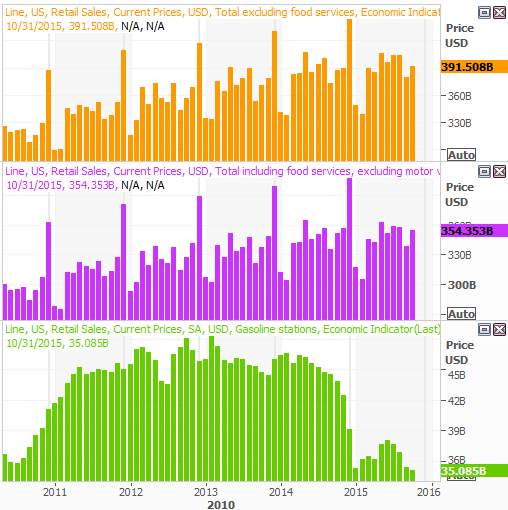
Source: Thomas Reuters
We also heard October's producer price inflation rate last week, and if it's an omen of what to expect when we get consumer inflation rates this week, then inflation may be the least of our problems. Deflation could be a bigger concern now, giving the Federal Reserve time and reason to delay the rate hike rumored to be in the cards next month.
Economic Calendar
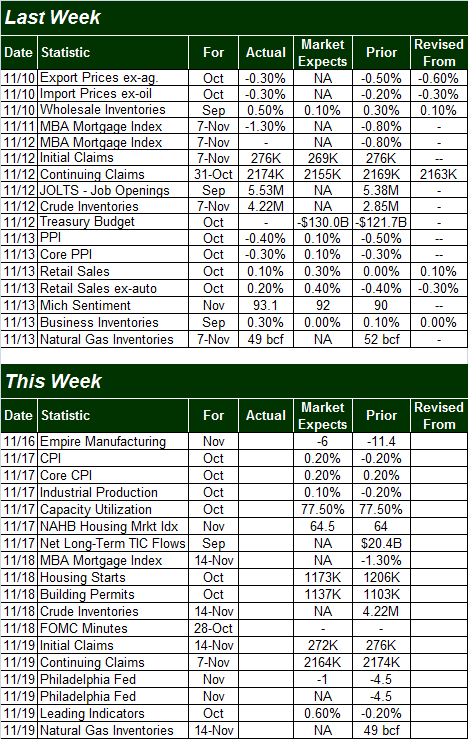
Source: Briefing.com
As was noted above, we'll be hearing October's consumer inflation news this week... on Tuesday, to be precise. Analysts are calling for a 0.1% increase on a core as well as a non-core basis, but it might be wise to prepare for an even weaker report.
Also on Tuesday we'll be getting October's industrial production and capacity utilization figures. Total production has been improving, but the slow-down in capacity utilization could be reason for concern (especially should productivity start to rollover).
Capacity Utilization and Industrial Productivity Chart
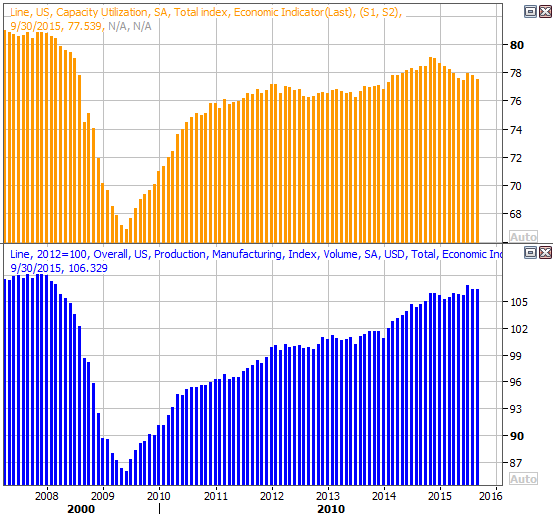
Source: Thomas Reuters
On Wednesday we'll hear last month's housing starts and building permits data. Starts have been trending higher, though permits appear to have hit a headwind. Part of that could be due to a seasonal slowdown (even though the seasonal-adjustment is supposed to weed such effects out).
Housing Starts and Building Permits Chart
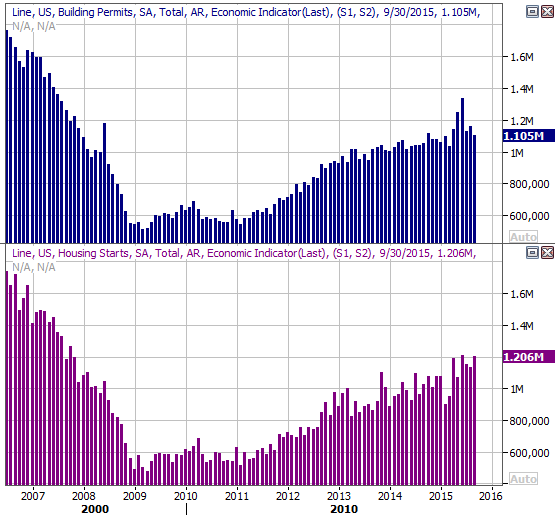
Source: Thomas Reuters
Stock Market Index Analysis
With four of last week's five trading sessions being losses, with most of those losses seemingly worse than the previous one, it's tough to say the market's momentum is anything but bearish. In fact, the best thing working in the market's favor right now is the fact that it fell so sharply last week, a dead-cat bounce could be in the making. To that end, the S&P 500 is right at some key technical support to up the odds of a near-term recovery. It's going to take some work to get - and keep - any bounce going though.
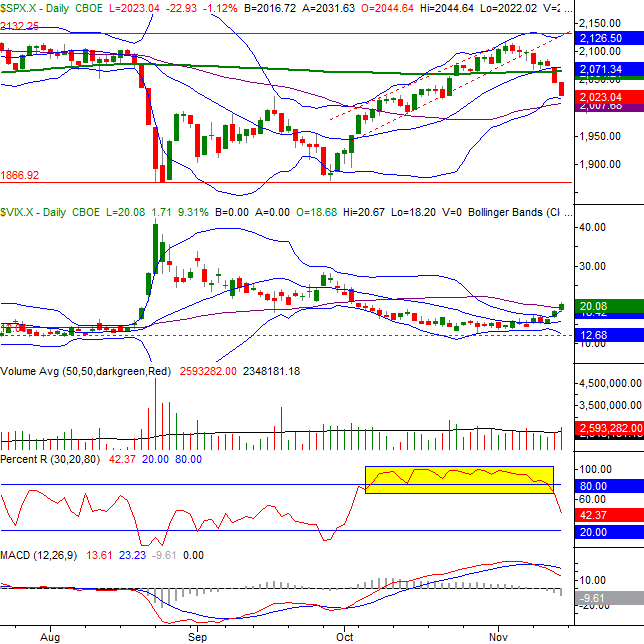
As the daily chart of the S&P 500 below illustrates, the index broke under the 20-day and 200-day moving average lines around 2070 and never looked back. The Percent R indicator broke back under the 80 threshold and then didn't poke back above it. We've also got a bearish MACD cross in place.
S&P 500 & VIX Daily Chart
Chart created with TradeStation
The good news is, Friday's close of 2023.04 is already starting to test the lower Bollinger band and close to testing the 50-day moving average line. The index may need to slip just a little lower to fully test and then bounce off of those lines, but after a 3.6% dip in just one week, the market is ripe for a pop. A bearish opening gap this week just might to the trick. The problem with that bullish theory is...
For the first time in a long time, the CBOE Volatility Index (VIX) (VXX) is trending higher, having pushed its way above its upper Bollinger band and above the 50-day moving average as of Friday.
Granted, we saw the VIX do the same in August, but it wasn't the same. In August, the VIX soared above its upper band lines in conjunction with a huge setback for stocks. This time, the trend is a lot better-paced. That means the odds of a quick rebound aren't quite as good as they were then. All the same, the S&P 500 would still need to break under the 50-day moving average line at 2008 to put that worst-case scenario in motion.
Note that it's possible the downtrend could merely pause early this week, act as if a reversal was nigh, and then resume the downtrend. Just watch carefully. Also note that a downtrend wouldn't be truly confirmed until the Percent R line gets AND STAYS under the 20 level.
At the other end of the spectrum, the S&P 500 would really need to break back above the 20-day and 200-day moving average lines around 2070 to even talk about the rally being underway again.
Zooming out to a weekly chart, we can see just how rough last week was. The weekly timeframe also puts the plunge in perspective - this may all just be part of major range-bound action, with the upper edge of that range at 2135 and the lower edge at 1867. The weekly timeframe also tells us last week's stumble looks a lot like August's pullback, which was sizeable, but it was over with pretty quickly.
S&P 500 & VIX Weekly Chart
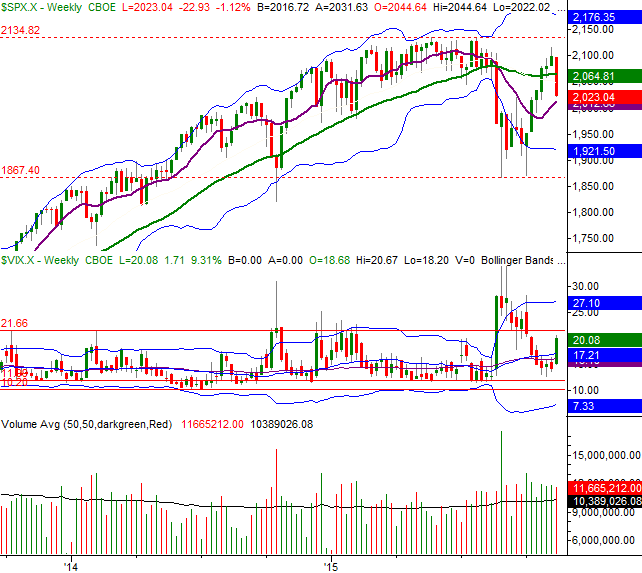
Chart created with TradeStation
In that light, don't be shocked if, should the S&P 500 edge a little lower this week, then it follows through and retests the established floor at 1867.
Also notice that in the weekly timeframe, the VIX is already at a familiar ceiling. This may become a factor during this week's trading. If the VIX's resistance at 21.60 does fail to cap the VIX, though - and the volatility index does happen to drift above it - that's also a sign that traders are thinking more and more bearishly, and will likely trade as such.
Putting it all together, this week is going to be a tricky one. Tread lightly, and don't get lured into anything until it becomes clear which side of the fence the market is really on.
Depth (Volume) Trend Already Bearish
While the market has been falling for a week and a half, the undertow shifted for the worst beforehand, and that undertow has been every bit as bearish as the market's steep losses would suggest.
As evidence of that bearish undertow, take a look at the NYSE's "Up" volume trend and the NYSE's "Down" volume trend. These opposing trends are always seen when the market is in motion, but it's rare to see the trends this strong. The "Down" volume trend is still picking up steam, while the "Up" volume trend continues to wane.
NYSE "Up" Volume and "Down" Volume Trend Chart
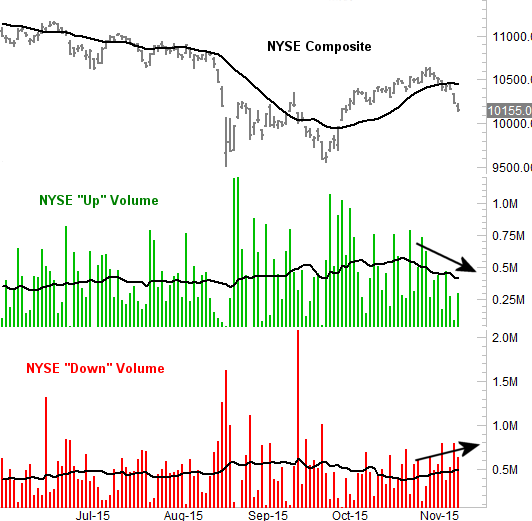
Chart made using TradeStation
This loosely suggests this downtrend isn't yet running out of gas; in most cases, the up/down volume tends to start shifting before the market trend reverses course.
Trade Well,
Price Headley
BigTrends.com
1-800-244-8736