BigTrends.com Weekly Market Outlook - Post-Election
Weekly Market Outlook - November 14, 2016
To call last week as wild week would still be an understatement of epic proportions. The S&P 500 (SPX) (SPY) gained 3.8% last week, which was big, but it was a victory made even more amazing by the fact that a Trump victory was supposed to be bad for the market (and for a few hours before Wednesday's open, it was very bad for stocks). A few hours after Donald Trump was confirmed as the next President though, the S&P 500 was not only up, but had cleared a key technical hurdle.
The bulls don't need to get too excited just yet. The rally ran out of gas on Thursday, and is once again stuck between a rock and a hard place. It just so happens that it happens to now be stuck on the bullish side of that rock and hard place.
We'll dissect it all below, after a quick run-down of last week's and this week's economic news.
Economic Data
It was a light week in terms of economic news last week, which is perhaps for the best - all eyes were on the election anyway. With the dust now settling from the voting process and fallout though, there was one announcement worth looking back and exploring - the JOLTS (job opening and labor turnover survey) report showed a slight contraction in the number of advertised jobs. That's not terribly unusual, but when one takes a step back and looks at the longer-term trend here, we can see a bit of stagnation of this data.
JOLTS (Job Openings and Labor Turnover) Chart
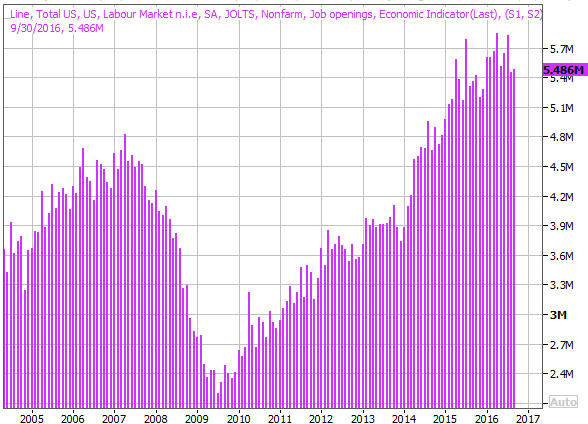
Source: Thomson Reuters
Everything else is on the following grid:
Economic Calendar
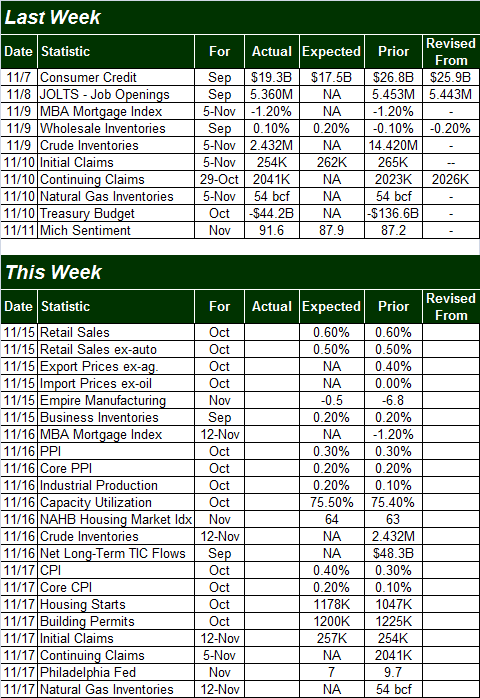
Source: Briefing.com
This week's economic dance card is going to make up for last week's lull.
The party starts on Tuesday with a report of October's retail sales. Economists are looking for another month of solid growth, with or without cars. Growth has been pretty healthy on the consumer spending front for a while. As the chart of year-over-year retail spending growth shows, it's up in every stratification except for gasoline stations, and weak gasoline station sales are a function of low oil prices (and even then we're seeing forward progress there).
Retail Sales (Year-Over-Year Growth) Chart
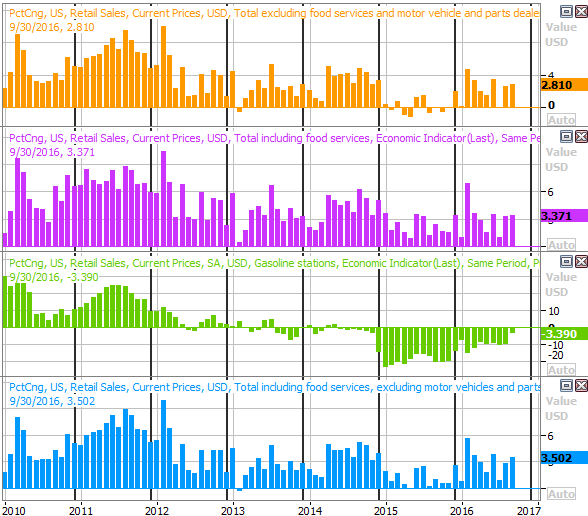
Source: Thomson Reuters
It's going to be a huge week for updates on our current inflation situation, with producer inflation data coming on Wednesday and the consumer inflation data report due on Thursday. Both are expected to rise again after doing so in September. On all fronts we're at or near inflation levels that will force the Federal Reserve to deal with it, whether or not food and energy costs are factored in.
Inflation Rates (Annualized) Chart
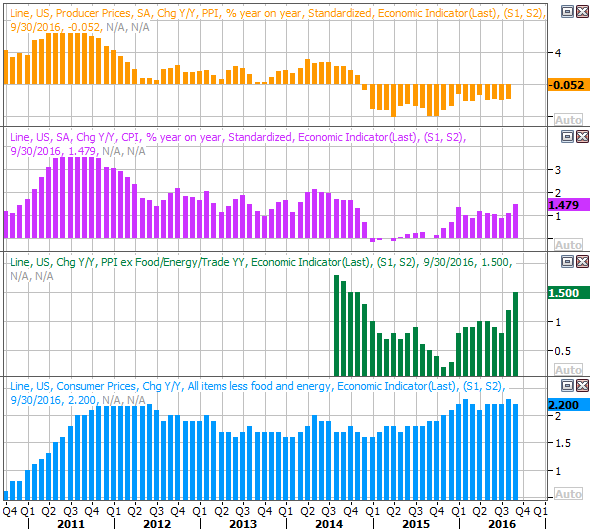
Source: Thomson Reuters
Also on Wednesday we'll hear about last month's capacity utilization and industrial productivity levels. Each has been a bit lethargic of late, though both are projected to have moved forward a bit for October. This one has more potential to move the market now more than it's seemed like it has in the past. We're not losing ground - yet - and a surprising advance would go far in bolstering the bullish argument.
Capacity Utilization and Industrial Productivity Chart
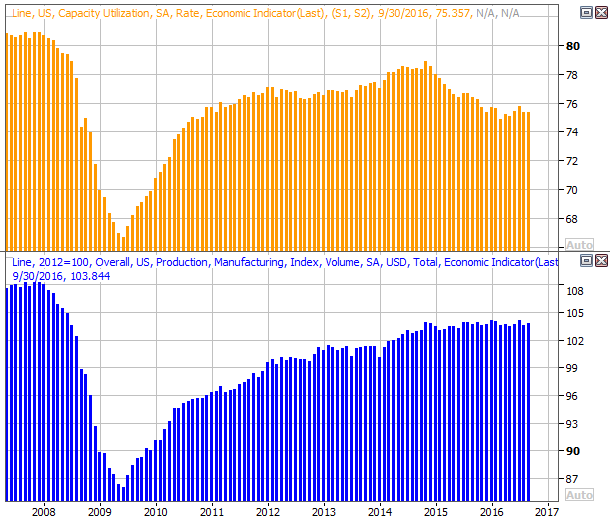
Source: Thomson Reuters
Finally, it's a big week for real estate, with housing starts and building permits coming on Thursday. There's been a bit of volatility here, and a lull. We're seeing broad growth though, and economists more or less expect that tepid uptrend to persist through last month.
Housing Starts and Building Permits Chart
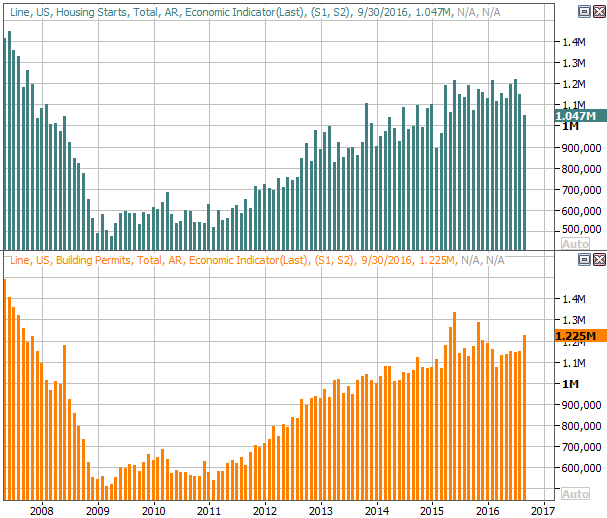 Source: Thomson Reuters
Stock Market Index Analysis
The bulls are hardly, cleanly over the hump, so to speak. They do have the wind at their back though.
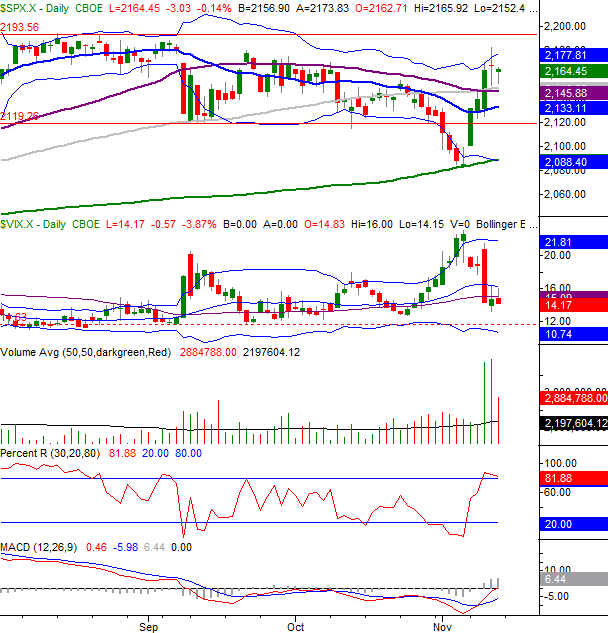
Take a look. On Wednesday - in a surprising response to the election's results - the S&P 500 hurdled a huge technical ceiling around 2145. That rally effort stalled the next day when it bumped into the upper Bollinger band at 2177. It's not as if the bears took firm control again though. Even as the index approached that 2145 area from the other direction, the bulls were already testing the waters again.
S&P 500 & VIX Daily Chart
Chart created with TradeStation
Also note that the CBOE Volatility Index (VIX) (VXX) broke back under its key moving averages, and though it toyed with a break back above them on Thursday and Friday, those technical ceilings remained intact.
Yet, the S&P 500 itself and the market as a whole is still on the fence. There's a fair amount of clarity as to when it might get off the fence though. The S&P 500 will need to punch through the upper band line at 2177.8 to achieve escape velocity. There's still a big risk just beyond that mark though....
... the horizontal line at 2194 marks the S&P 500's ultimate peak from August. Breaking above that mark would be a huge technical victory, and inspiring. That's a big if though, particularly with the VIX back near more absolute lows. That's not to say the market can't make forward progress with a low VIX. It does make it tougher to do so though.
Zooming out to a weekly chart of the S&P 500 w can gain a little more perspective on last week's surprising bounce, and how close the VIX is to a major support level.
S&P 500 &VIX Weekly Chart
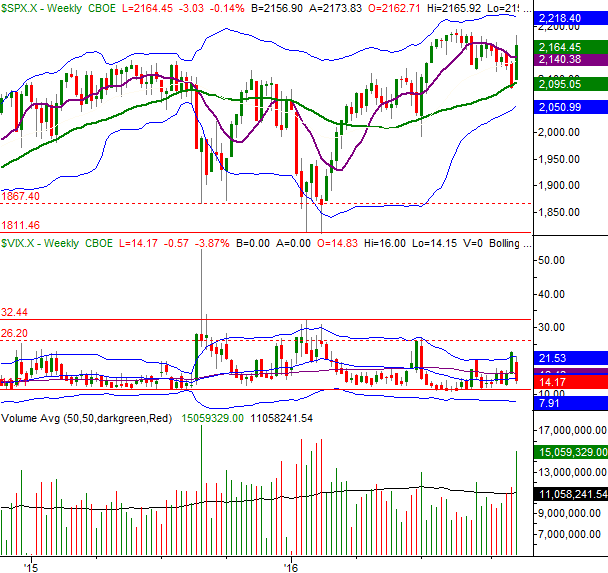
Chart created with TradeStation
The daily chart of the NASDAQ Composite (COMP) looks about the same, and has its own ultimate technical ceilings. For the composite, it's 5343, where the index peaked in September and where the upper Bollinger band is now.
NASDAQ Composite & VXN Daily Chart
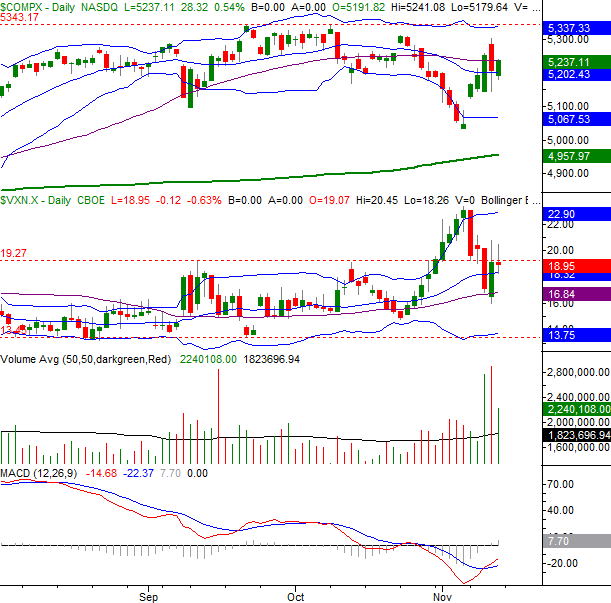
Chart created with TradeStation
Don't misread any of this message. There's still a downside risk. The path to realizing that downside risk is simply more difficult to navigate. For the worst fears to be realized, the S&P 500 will need to break under the big-time 2145 level and then pull below a key support line at 2088. That's a tall order. There's also a big floor at 5020 for the NASDAQ. Until those floor snap, anything still could happen even though the bulls ended last week with a measurable edge.
Presidential Cycle, Revisited
Are you a believer in calendar-based tendencies? Does the election cycle drive those tendencies? If so, the chart below may be telling about what to expect for the rest of this year, and what to expect from early 2017 on once Donald Trump takes the helm.
The black line plots the average S&P 500 performance during the four-year cycle beginning with the first day of the calendar year a new President is inaugurated. The blue line plots how the S&P 500 has performed since the beginning of 2013, when President Obama was inaugurated for his second term.
S&P 500 Average Performance During Four-Year Presidential Term Chart
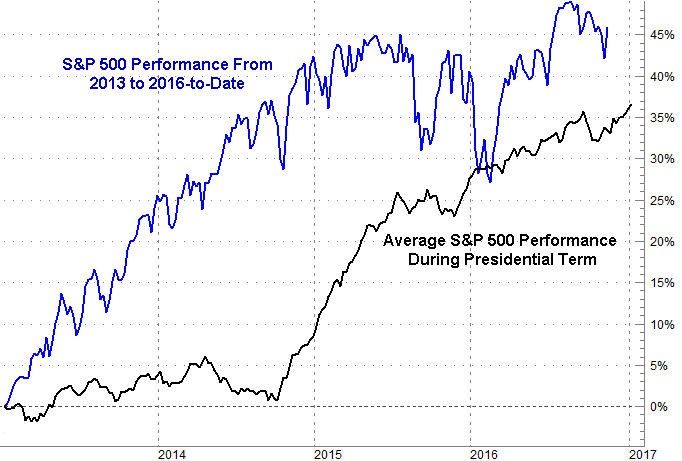 Chart created with TradeNavigator
To be fair, the disparity between good four-year spans and bad four-year spans is wide, so take it all with a grain of salt. But, the averages are the averages for a reason.
Trade Well,
Price Headley
BigTrends.com
1-800-244-8736