Debit Spreads
Debit spreads are a type of option trade involving two different options on the same stock or index, aiming to capitalize on an expected movement of the chart in question, but hedging the 'bet', so to speak, with one of the two options. They're an attractive trade because the risk is limited, though the maximum profit is also capped.
Debit spreads are named such because they incur a net cost, or debit, to initiate. If the stock or index moves as expected, the debit spread is closed out at a better net price than the entry cost.
This type of option trade can be bearish, or bullish. In a bullish case, call options are used. An example will best illustrate how and why they're employed.
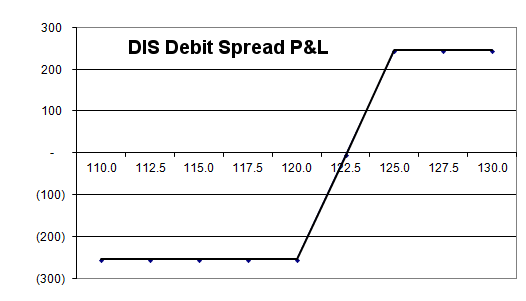
Let's assume Disney (DIS) is positioned to move higher from its current price of $120. In order to capitalize on that move, we could buy a two-month call with a strike price of 120 at a cost of $5.75 ($575 per contract). To offset some of that cost and hedge the bet, we could sell, or short, the same number of two-month 125 calls at a price of $3.20 (or $320 per contract). The net cost for this trade is the difference between two contracts... $2.55, or $255 per contract.
The hope here is that Disney shares would move above a price of $125. It doesn't matter how much beyond that price DIS would move, as the maximum profit attainable is the difference between the two strike prices -- $5.00, or $500 per contract -- minus the $2.55, or $255 per contract entry price. That would be achieved with Disney moving to any price above $125. The profit-and-loss scenario chart below illustrates how this plays out. The best profit one could hope to achieve on this trade is a gain of $245 per contract (by closing the trade out and pocketing the $500 difference between the price of the two contracts), and the worst-case scenario is a loss of $255 per contract.... which would be realized if the options expired worthless (if DIS closed under $120 at the time of expiration).
DIS Call Debit Spread Theoretical Profit/Loss Graph
Note that there are two possible paths to a profit. Ideally, the trade is reversed, simply by buying back the short 125 calls and selling the long 120 calls for a net gain. The second scenario is, the short 125 calls are exercised against the trader once DIS moved above $125. Even in the event that should happen, however, a trader could use the 120 call he/she owns to buy those shares needed to deliver for the exercise of the 125 call (and would still pocket the $500 difference per contract).
Note that the long/purchased option is closer to the strike price, while the shorted/sold call has a strike price that is further away from the current stock price. The same idea would apply to a bearish debt spread using put options... the short/sold call is the one further away from the stock's current price, while the purchased long call generally has a strike price nearer the stock's present price.
In fact, let's walk through a bearish debit spread scenario.
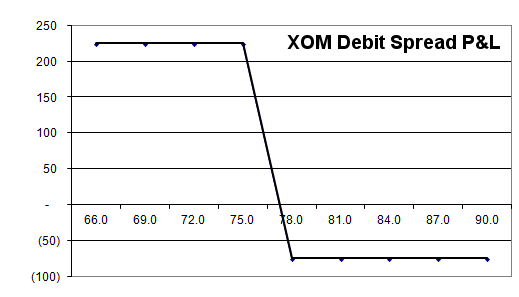
Let's assume Exxon-Mobil (XOM) is apt to move lower from its present price of $80, but that outlook is only a near-term one... say a month or so. We could enter a debit spread position on XOM by buying a put near the current price of $80, and selling, or shorting, the same number of put options with a lower strike price, at a lower cost. Let's say we buy a one-month put with a 78 strike at a price of $1.90 (or $190 per contract), but we'll sell/short the same number of one-month puts with a strike of 75 at a cost of $1.15 (or $115 per contract). The net cost to enter this trade would be the difference... $75 per contract.
The maximum gain is realized if and when XOM falls to or below 75, where the strike price of the short/sold put lies. At that price, the 78 put could be sold and the 75 put could be bought back for a net credit of the difference between the two strikes.... $3.00 (or $300 per contract). Subtracting the initial debit of $75, the maximum profit of this trade is $225.
The worst-case scenario loss is the initial $75 debit per contract. That maximum loss would be realized of XOM remains above 78 - where the upper strike price was - by the time the option expires, which would mean both options expire worthless.
XOM Put Debit Spread Theoretical Profit/Loss Graph
In the bearish debit spread example it appeared the maximum loss and maximum gain scenario was heavy on the reward and light on the risk, but it should be noted that the odds of realizing that maximum gain were muted considering where the two strike prices of the options involved, and the limited amount of time involved. On that note...
Most traders prefer to go long on, or buy, an option that's at or near the money as one leg of a debit spread trade, and sell, or short, an out of the money option for the other leg of the trade. Broadly speaking, that scenario yields the optimal risk/reward scenario. It should be noted, though, that profit-and-loss and scenarios can be tweaked to suit a trader's preferences by using deeper in the money or deeper out of the money options (or by using different timeframes).
Use of profit and loss scenario graphs like the ones above are a good means for a trader to weigh the merits of different debit spread trading scenarios.