AT&T Inc. (T) got kicked out of the D.J. Industrial Average in March 2015 to make room for Apple Inc. (AAPL) after the tech icon split seven for one in 2014. It’s performed much better than its replacement in the last two years but still, hasn’t cleared 2007 resistance in the mid-40s. Fortunately for shareholders, that breakout may proceed in coming months, with bullish sentiment driven by the proposed Time Warner Inc. (TWX) merger.
President Trump has criticized the merger, but many market analysts believe it will still go through due to the Oval Office’s business-friendly policies. Continued uncertainty has denied both equities typical premiums afforded to mergers between blue chip equals but the deficit may offer a low-risk buying opportunity once AT&T settles a big labor dispute with the Communications Workers Of America.
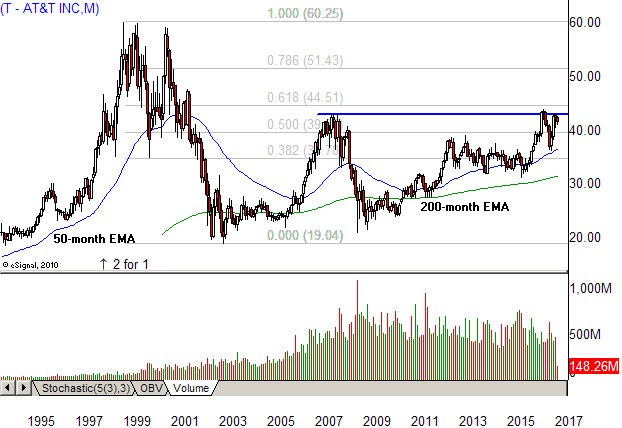
T Long-Term Chart (1993–2017)
The company has undergone many transformations and structural changes over the decades, so the long-term chart strings together different corporate entities. It rallied above the 1990 high at $16.19 in 1992 and entered a powerful trend advance that posted multiple rally waves into the January 1999 top at $59.94, marking the highest high in the stock’s multi-decade public history.
Buyers reloaded positions in the mid-30s in early 2000 while an October test at range resistance ran into a buzzsaw of selling pressure. It lost ground through the rest of the Dot.com bear market and then failed to turn higher with thousands of other stocks at the October 2002 low. The 9-year low at 19.65 in March 2003 finally ended the decline, but the subsequent bounce failed to generate interest, easing into a 3-year symmetrical triangle with resistance in the upper-20s.
The stock broke out in 2006 and surged higher into October 2007, topping out at the 50% bear market retracement level and turning south during the 2008 economic collapse. It bounced less than three points above the 2003 low in November but failed to gain traction once again, grinding sideways to higher in a choppy uptick that underperformed broad benchmarks into the 2013 high at $39.
A long lazy downtrend finally ended in the second half of 2015, giving way to a recovery wave that finally reached 2007 resistance in July 2016. Aggressive sellers emerged at that level, triggered a major pullback that found support in the mid-30s after the November election. Price action since that time has carved a recovery wave that stalled 86-cents under the July high, followed by a multi-week consolidation between $40 and $43.
T Short-Term Chart (2014–2017)
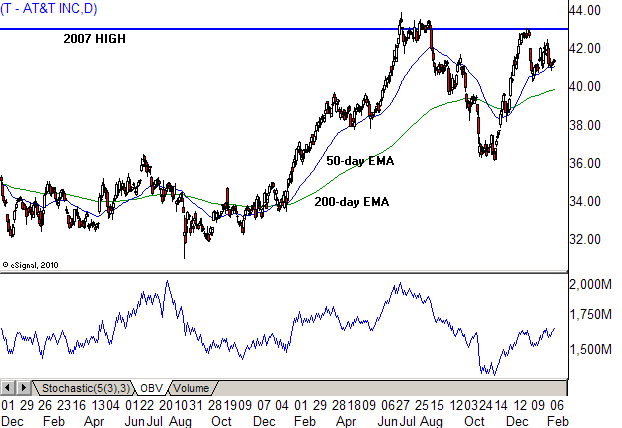
The 2-year downtrend into 2015 connected a declining highs trendline that broke to the upside in April 2016 when the stock rallied above $36. It tested new support in the fourth quarter of 2016, with the strong bounce setting the stage for a major test at 10-year resistance. However, the year-end rally came up short, giving way to mixed action that signals continued anxiety about the proposed merger.
On Balance Volume (OBV) topped out at a multi-year high in July 2015 while the stock was stuck in a downtrend and tested that level a year later during the breakout attempt. Trump’s skeptical comments triggering a renewed distribution wave that dropped the indicator to a 2-year low ahead of the bounce into 2017. That buying wave has failed to rebuild the lost shareholder base, denying a premium that could translate into a multi-year breakout.
The Bottom Line
AT&T is trading a few points under 2007 resistance following an aggressive distribution wave, triggered by worries the proposed Time Warner merger will fail. However, that anxiety may offer a low-risk buying opportunity because downside risk appears limited, even if the merger fails. If it does succeed, buying at the current level could offer a strong tailwind for outsized gains.
Courtesy of Investopedia