Arms TRIN Index Indicates This Market Isn't As Strong As It Appears
Arms Index Says This Rally Isn't Especially Well Supported
The market's march into new-high territory is certainly exciting. But, it's far from bulletproof evidence that more of the same is on the way. Not only do stocks at this level bring valuation concerns, the rally itself may be less healthy than one might imagine with just a quick glance. The fact is, this bullish effort doesn't have as much participation as it needs to be considered a long-lasting prospect.
The red flag lies in the Arms Index, or Trading Index, which is often abbreviated as TRIN. Without getting into the complete mechanics of it (you can explore the indicator in detail here), the Arms Index compares the advance/decline ratio to the up-volume/down-volume ratio. Most of the time the NYSE's advancers, decliners, up volume, and down volume are considered, though the Arms Index can be calculated for a variety of stock stratifications.
In a "normal" environment, the Arms Index is 1.0, meaning the advance/decline comparison is about the same level at the up-volume/down-volume ratio. Even if both are at strong (bullish) readings of 4.0, as long as they're both at 4.0 and the TRIN reading is 1.0 (4.0/4.0), then there's a balance of breadth (advancers and decliners) and depth (volume) that suggests the move is well supported and has the participation it needs.
Ditto for pullbacks. That is, if decliners outpace advancers to the same degree down-volume outpaces up-volume, then that selloff has the right amount of participation and could last indefinitely.
The points in time where the advancer/decliner ratio doesn't jibe with the up-volume/down-volume ratio, however, are noteworthy red flags that indicate a trend is out of balance... that it doesn't have the actual participation it should have.
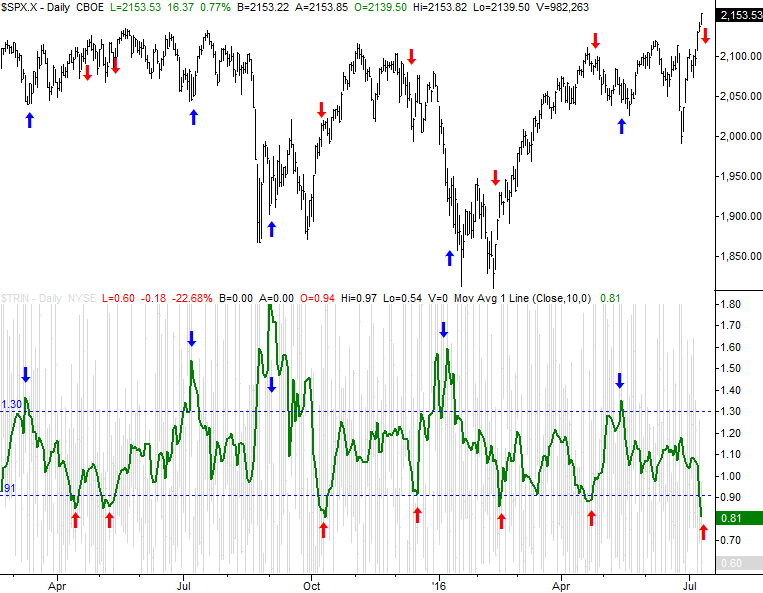
That's what's happened to the market this week. The Arms Index has plummeted to a sub-90 reading, which as you can see below is relatively unusual. The cause? There's not nearly enough bullish volume behind the current rally effort to justify the strength of the advancers versus the decliners. Something's got to give soon. More often than not, the imbalance is corrected by a pullback. The uber-low TRIN readings are all marked with a red "up" arrow, and the S&P 500 is correspondingly marked with a red "down" arrow. Just for good measure, we've added TRIN buy signals as well, with blue arrows.
It's not difficult to see the Arms Index isn't a perfect tool. On the other hand, it's not a bad one, and can be successfully used to confirm other suspicious, bullish and bearish. [Also note that the last few months' TRIN sell signals haven't been as reliable as they normally are.]
Conclusions? At the very least any bulls should be concerned about a pullback here; the rally effort so far is not well supported in terms of dollars being spent on stock purchases. There's some, but there's not enough considering how much most stocks have gained since late June.
One of the downsides of the Arms Index as a trading tool is that it's not laser precise in terms of when a rollover might take shape, and how long it may last. But, there are other tools that can help out on those fronts.
To that end, we'll just caution that anything can and will happen. As overvalued and overbought as stocks are, they were that way too in 1999 and kept right on roaring. The Arms Index is an odds-making tool... not an indicator with perfect results.
Whatever the case, just know that this rally effort isn't adequately supported. Something will have to change sometime, sooner or later.