$10 Trillion Is Parked On The Sidelines In Negative-Yield Accounts
Will $70 trillion in cash wake up the stock market?
Worldwide, investors have stashed away $70 trillion in cash, according to BlackRock's president Rob Kapito. That's a big number. Let's put it — and what this means — into perspective.
How much is $70 trillion?
A $70 trillion dividend spread evenly among the U.S. population would come out to $218,000 per person.
If you took $70 trillion worth of $100 bills and stacked them on top of each other, the pile would be about 44,000 miles high.
About $10 trillion of those $70 trillion is parked in negative-yield accounts, eroding value ever day.
No doubt, investors are eager to put that money to work. The question is, could the $70 trillion cash pile wake up the stock market?
The stock market is a supply/demand driven market, so $70 trillion worth of demand could certainly jolt stocks higher. Since we are talking about a global market that's significantly larger than $70 trillion, we — again — should put that number into perspective.
$70 trillion put into even more perspective
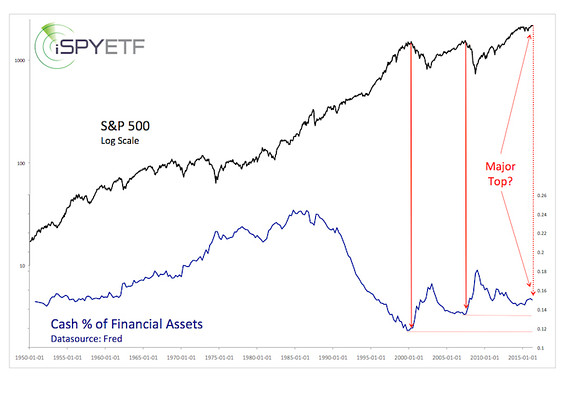
The chart below is based on U.S. data from the Federal Reserve. It plots the S&P 500 against cash as percentage of U.S. financial assets.
Based on this data, 15% (or $10.8 trillion) of U.S. financial assets are currently parked in cash. Going back to 1950, the current cash allocation is low. Based on the last 20 years, the current cash levels are about average.
Since many investors are looking for a major market top, it's worth pointing out that the 2000 and 2007 tops saw cash drop to 12% and 13.5% (red line).
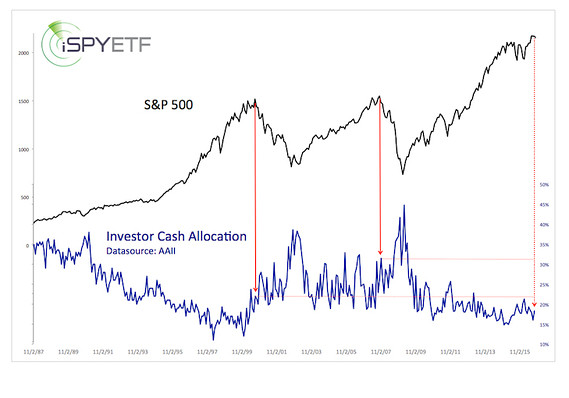
The second chart is based on survey data from the American Association for Individual Investors (AAII). According to AAII, investors kept 18% of their portfolio in cash. We always pay more attention to actual money flow data (Federal Reserve) than surveys (AAII).
Call it what it is
Money parked in cash vehicles in one of many ways to gauge investor sentiment. Low cash levels are a sign of confidence and extreme confidence (and low cash levels such as in 2000 and 2007) is usually seen near market tops.
It should be noted that the cash allocation (based on the Federal Reserve data) increased since the beginning of 2014.
This harmonizes with the Profit Radar Report's sentiment analysis, which — since 2013 — has been saying that investors are too pessimistic for a major market top . Yes, despite rising (although in a very choppy manner) prices, investors have been increasing their cash levels for the last few years (wall of worry?).
In January and February 2016, when the S&P 500 traded near 1,800, the Profit Radar Report noted that: "Sentiment around the May 2015 top was not bullish enough for a major market top" and pointed out bearish sentiment extremes (bullish for stocks) while recommending to buy at S&P 1,828 on Feb. 11.
The bottom line
The money parked in cash should eventually buoy stocks. But before the market moves higher, it may decide to flush out the weak hands.
Courtesy of marketwatch.com